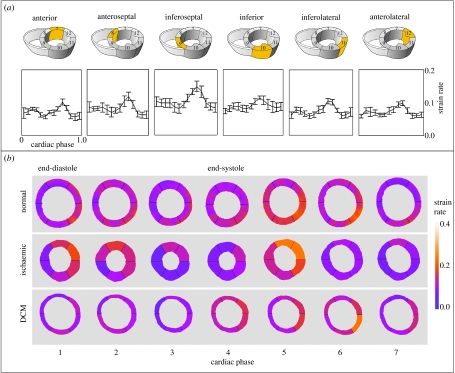
Figure 5.
(a) Mean±s.d. of the strain distribution over time for normal subjects in different regions of the heart and (b) normalized results in normal subjects over time for seven frames of the cardiac cycle. This can be compared to the strain rate distribution in an ischaemic and dilated cardiomyopathy patient. The strain rate images are aligned so that the anterior region is at the top of the image.

