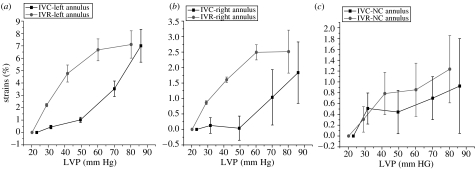
Figure 11.
Annular circumferential per cent deformation with changes in LVP during IVC and IVR. Data are expressed as group mean±s.e.m. Annular circumferential stress–strain response for each of the three segments was nonlinear. Furthermore, analysis of stress–strain deformation showed marked hysteresis from IVC to IVR in the (a) left and (b) right annular sectors, but no hysteresis effect in the (c) NC annular sector.

