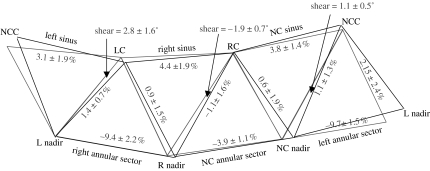
Figure 8.
Shear (torsional deformation) of the aortic root. Data from Dagum et al. (1999) expressed as group mean±s.d. per cent change of deformation (longitudinal, circumferential, shear and torsion) during ejection. Shear deformation of the left, right and NC root was calculated from the triplet of markers (one commissures marker and two nadir markers) defining the aortic root regions. Torsion measured the degree of rotation of the commissures relative to the base caused by shear deformation at each region (when looking down from the aorta towards the ventricle). Black triangle, baseline configuration at end IVC; grey triangle, deformed configuration at the end of ejection.

