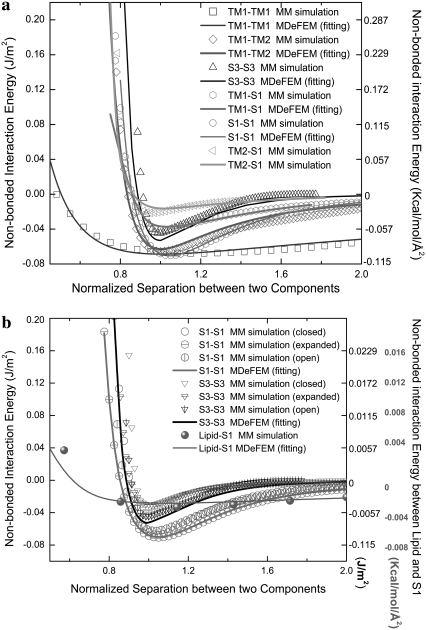
FIGURE 7.
Example of fitting of the total nonbonded interaction energy (per area) between continuum components of E. coli-MscL. The x axis is the normalized separation between the center-of-masses (with 1.0 being the equilibrium spacing). (a) Comparison between FEM and molecular mechanics calculations for helical pairs in the closed structural model. (b) The fitted set of parameters is fairly transferable to other structural states (expanded/intermediate and opened). In b, the scale for the interaction between lipid and S1 helices is given on the right of the figure, whereas the scale for interaction between helices is given on the left.

