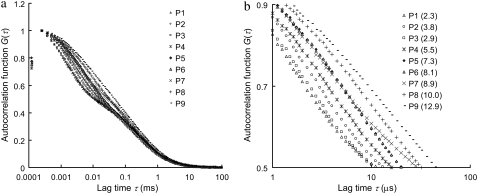
FIGURE 1.
(a) Autocorrelation curves of nine single-stranded DNA probes (probe P1–P9 in Table 1). (b) A zoom-in of fast-relaxation process region on autocorrelogram. The mean relaxation time (MRT, 〈τr〉 in μs) of each probe is shown in parentheses. The autocorrelation curves are normalized at their peaks for comparison purpose.

