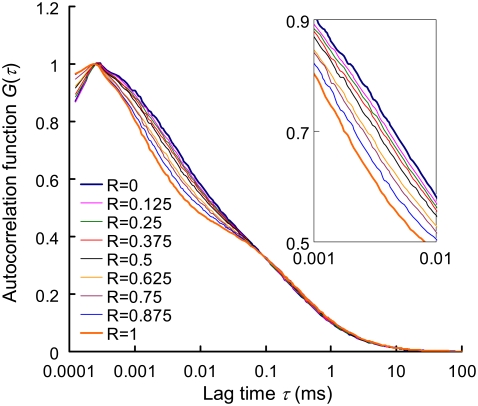
FIGURE 3.
Autocorrelation curves of nine binary (dsDNA/ssDNA) mixtures. R represents the mixing molar fraction of dsDNA to total DNA. The overall DNA concentration (i.e., (ssDNA) + (dsDNA)) is fixed at 5 nM in each sample. The representative autocorrelation curves are averages from six 100-s measurements. The inset is zoom-in of lag time from 1 to 10 μs.

