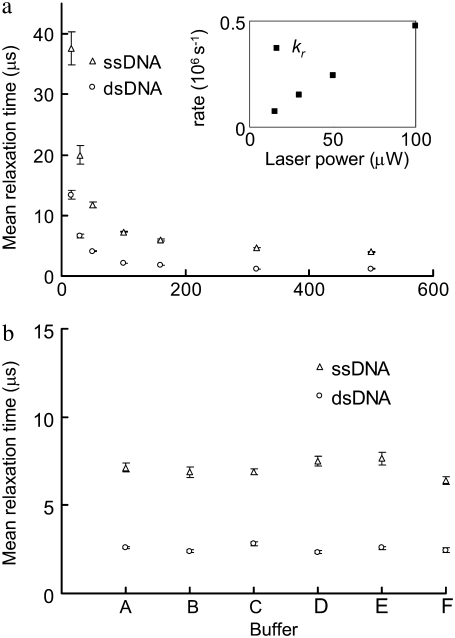
FIGURE 4.
(a) MRTs of the ssDNA and the dsDNA estimated by FCS under various laser illumination powers. The inset shows the relaxation rates (kr, 106s−1) of Cy5 on the dsDNA at various laser powers. (b) The MRTs under different buffer conditions. (A) In a buffer containing 100 mM sodium phosphate (pH 7.0) and 50 mM NaCl. (B) In a PCR buffer containing 40 mM Tris-HCl (pH 8.8), 20 mM KCl, 20 mM (MH4)2SO4, 4 mM MgCl2, and 0.2% Triton X-100. (C) In a buffer containing 20 mM Tris-HCl (pH 7.5), 50 mM NaCl, 5 mM MgCl2, and 0.1% NP40 and 143 mM β-mercaptoethanol. (D) In a buffer containing 20 mM Tris-HCl (pH 7.5), 50 mM NaCl, 5 mM MgCl2, 0.1% NP40, and 2 mM Trolox. (E) In a buffer containing 20 mM Tris-HCl (pH 7.5), 50 mM NaCl, 5 mM MgCl2, 0.1% NP40, and 100 mM KI. (F) In water. The dsDNA is first prepared in a 50 mM Tris-HCl (pH 8.0) buffer at 1 μM. Then it is 200-fold diluted in the above solutions. Error bars represent SD from six FCS measurements.

