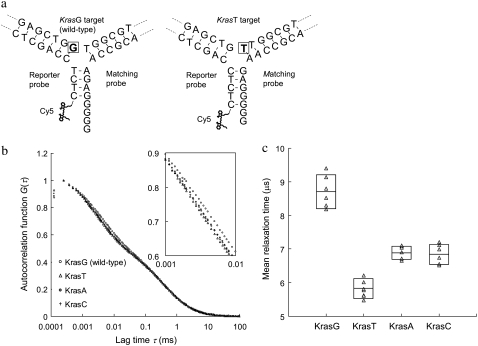
FIGURE 5.
Detection of single-nucleotide variants on Kras targets using the DNA 3WJ method. (a) Schematics of DNA 3WJs expected to form with KrasG (wild-type) and KrasT (mutant type) targets, respectively. In presence of KrasG target in solution, a (G)4 overhang is formed at the end of the third arm. On the other hand, in presence of KrasT target, a shorter (G)2 overhang is formed. The nucleotide under investigation is marked by a square. (b) Autocorrelation curves from samples containing reporter probe, matching probe and any of the four Kras targets. The inset is the zoom-in of lag time from 1 to 10 μs. (c) MRTs measured by FCS for four different Kras targets. Each measured data point is represented by a triangle (Δ). The boxes represent the size of SD and the center lines indicate the averages.

