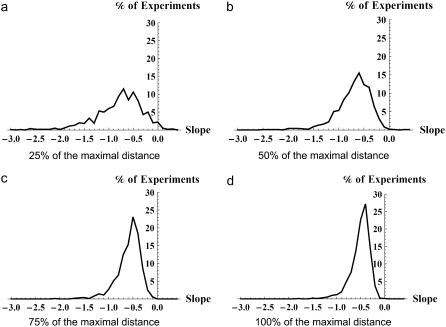
FIGURE 5.
Five-node networks. Histogram of slopes of best-fit lines to the average number of limit cycles (horizontal axis) versus percentage of experiments with a given slope (vertical axis). The panels from left to right include networks with increasing PF-distance, with 25%, 50%, 75%, and 100% of the maximal distance.

