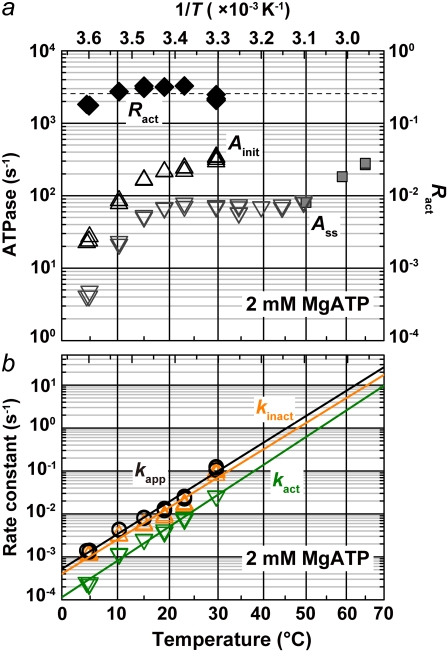
FIGURE 3.
Temperature dependence of the parameters characterizing the hydrolysis activity at 2 mM MgATP. (a) The initial (Ainit) and steady-state (Ass) activities are indicated by triangles and inverted triangles, respectively. The steady-state values obtained with the thermophilic regeneration system (gray squares) are likely underestimated. The fraction of active F1 at steady state (Ract = Ass/Ainit) is indicated by black diamonds. (Dashed line) Average of Ract between 4 and 30°C; T, absolute temperature. (b) The black line represents the apparent rate constant, kapp, for the relaxation from the initial high-activity state to the steady state, and indicates an activation energy of 120 kJ K−1 mol−1. Green and orange lines indicate the rate constants for the conversion from active to inactive (kinact) and from inactive to active (kact) states, respectively, with activation energies of 119 kJ K−1 mol−1 and 126 kJ K−1 mol−1 for kinact and kact, respectively.

