FIGURE 6.
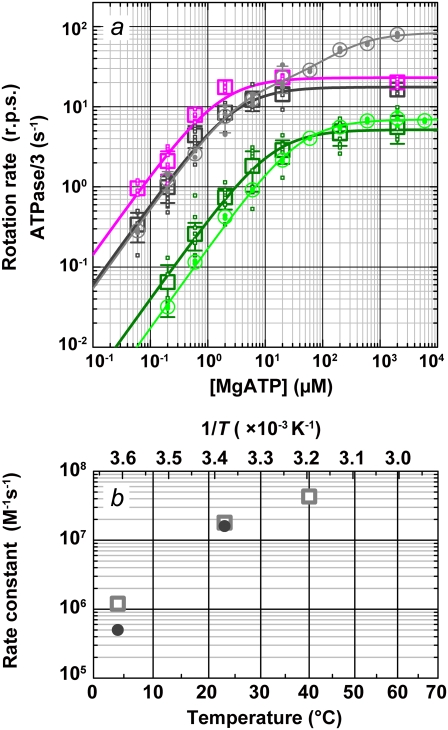
Comparison of rotation and hydrolysis rates. (a) ATP dependence of the rotation rates (squares) and one-third of the initial hydrolysis rates (circles). Dark green (rotation) and green (hydrolysis), 4°C; black and gray, 23°C; magenta, rotation at 40°C. Small symbols are individual rates, and large symbols their average (n ≥ 5 for rotation and 2 ≤ n ≤ 4 for hydrolysis); error bars show the standard deviation larger than the symbol size. Individual rotation rates are the time average over >5 consecutive revolutions (usually >100) for a 0.29-μm bead or its duplex. Curves show fit with Michaelis-Menten kinetics: V = Vmax[ATP]/(Km + [ATP]). For rotation, Vmax and Km are 5.2 rps and 13 μM at 4°C (dark green), 18 rps and 2.9 μM at 23°C (black), and 23 rps and 1.6 μM at 40°C (magenta). For hydrolysis, 3 × Vmax and Km are 21 s−1 and 40 μM at 4°C (green). Hydrolysis at 23°C (gray) required two sets of parameters: V = (Vmax1Km2[ATP] + Vmax2[ATP]2)/([ATP]2 + Km2[ATP] + Km1Km2), with 3 × Vmax1 = 59 s−1, Km1 = 3.7 μM, 3 × Vmax2= 252 s−1, and Km2= 246 μM. (b) Temperature dependence of the apparent rate of ATP binding estimated from the data in a (3 × Vmax/Km; squares, rotation; circles, hydrolysis).

