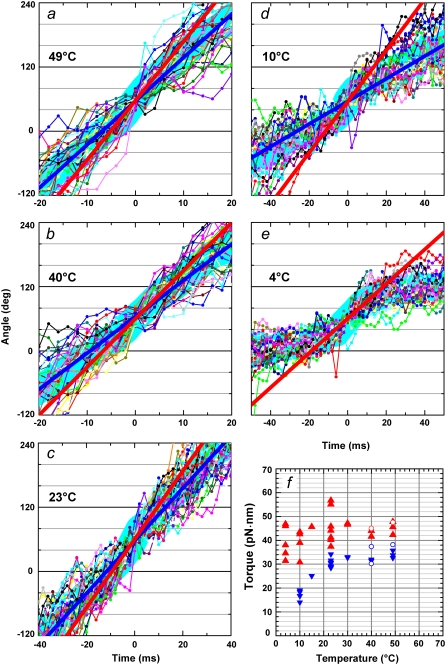
FIGURE 7.
Temperature dependence of the torque at 2 mM ATP. (a–e) Stepping records for a single 0.49-μm bead. Thin lines with dots show 30 consecutive steps selected from a rotation time course, with their average (thick cyan line). Individual step records have been shifted vertically by a multiple of 120° to obtain the overlap. Angle zero was chosen such that most of the pauses (or stumbling) in the time course fall on a multiple of 120°. Time zero for each step record was assigned by eye to the data point closest to 60°. Straight red lines show linear fit to the thick cyan line between 30 and 90°, and straight blue lines to the entire time course encompassing the 30 steps. (f) Summary of torque values estimated from Eq. 1 and the slope of the fitted straight line. Red triangles show fits to individual bead records over the 30–90° portion (a–e, red lines), and blue triangles over the entire time course (a–d, blue lines). Circles show torque values estimated for 0.49-μm bead duplexes; in this case, the frictional drag coefficient, ξ, in Eq. 1 is given by  where x1 and x2 are the radii of rotation (x1 was taken as zero).

