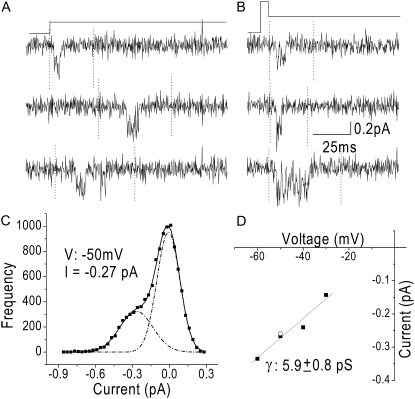
FIGURE 3.
Measured current amplitudes are the same when currents are elicited using depolarizations or tail-current protocols. (A) Capacity- and leak-corrected single-channel currents from a cell-attached patch elicited with a 50-mV step depolarization (−100 mV to −50 mV) with 20 mM Ca2+ as the permeant ion. Data were sampled at 20 kHz, filtered at 2 kHz, and downsampled to 4 kHz offline. (B) Capacity- and leak-corrected single-channel currents from the same patch as in A elicited with the tail-current protocol shown above. Patches were depolarized to 0 mV for 3 ms and subsequently hyperpolarized for 80 ms, in this case to −50 mV. Single-channel current amplitudes were determined from all-points histograms from selected segments of active traces. Selected segments were marked (dotted lines) from ∼100 sweeps per potential, concatenated, and used to generate the amplitude histogram. The data were binned into 30-fA bins and fit with a sum of two Gaussians. The signal/noise ratio was ∼3 at −30 mV and increased to ∼7 at −50 mV. (C) Amplitude histogram for currents elicited with 50-mV step depolarizations. The dotted black lines are the Gaussian fit of the closed and open states, and the solid line is the sum of the Gaussians. The open-channel current at −50 mV was measured to be −0.27 pA. The area under the curve bears no relationship to open and closed durations, because the data used to generate the amplitude histogram excluded much of the closed-state data. (D) The current-voltage relationship for the patch shown in A and B. The solid line is a linear fit to the data with a slope conductance of 5.9 ± 0.8 pS. The two points at −50 mV were calculated using the protocols from A and B.

