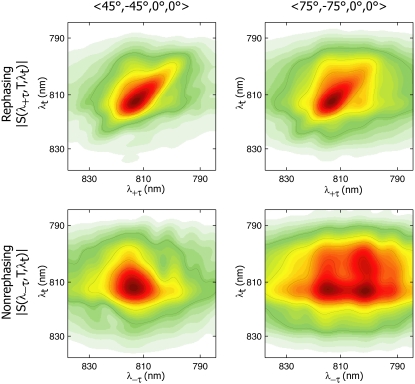
FIGURE 2.
Rephasing (top) and nonrephasing (bottom) absolute magnitude 2D spectra of FMO from P. aestuarii at T = 400 fs, measured with polarizations 〈45°, −45°, 0°, 0°〉 (left) and 〈75°, −75°, 0°, 0°〉 (right) of laser pulses 1, 2, 3, and 4, respectively. The nonrephasing spectra show distinct spectral features under the two polarization conditions that can be used to obtain excitonic structural information. The strong crosspeak at (λτ = 804 nm, λt = 814 nm) in the 〈75°, −75°, 0°, 0°〉 nonrephasing spectrum is indicative of excitation energy transfer.

