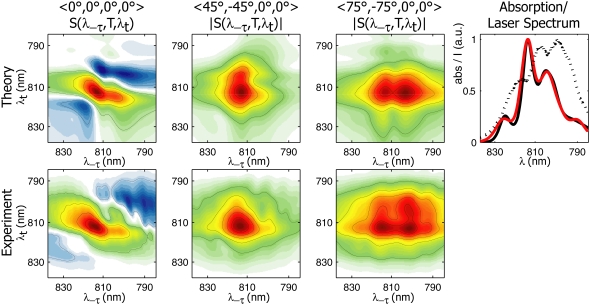
FIGURE 3.
Theoretical and experimental nonrephasing spectra of FMO from P. aestuarii at T = 400 fs and 77 K. (Top row, left to right) Theoretical 〈0°, 0°, 0°, 0°〉, 〈45°, −45°, 0°, 0°〉, and 〈75°, −75°, 0°, 0°〉 2D spectra. (Top right) Experimental and theoretical linear absorption spectra in black and red, respectively; the dotted line indicates the laser spectrum of pulses used to measure 2D spectra. (Bottom row, left to right): Experimental 〈0°, 0°, 0°, 0°〉, 〈45°, −45°, 0°, 0°〉, and 〈75°, −75°, 0°, 0°〉 2D spectra.

