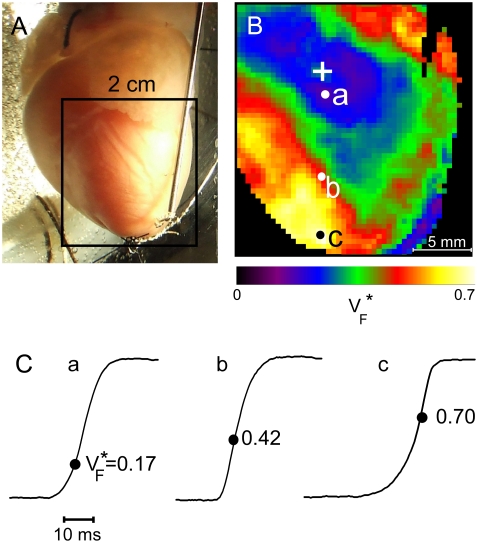
FIGURE 1.
Experimental setup and typical  recording. (A) Langendorff-perfused guinea pig heart. The black square indicates a typical field of view of optical mapping movies. (B) Experimentally determined
  map. Tissue was stimulated at the location marked “+”. (C) Upstrokes from locations a–c of B, as marked. The steepest point of the upstroke is marked and the fraction of the peak potential at the steepest point is indicated.

