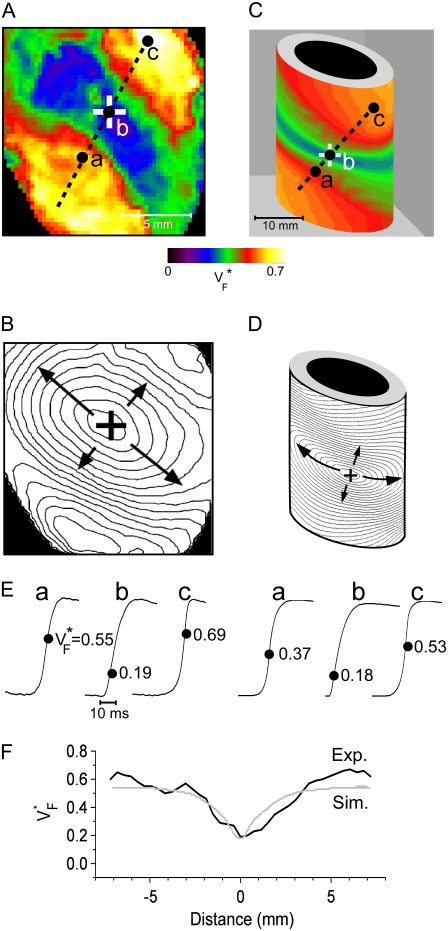
FIGURE 2.
Variation of upstroke morphology for free wall stimulation in experiment and simulation. (A) Experimental  map for point stimulation at the center of the left ventricle. The stimulation site is marked “+”, the dashed line marks a section of the surface that we use for comparison of profiles (see F). (B) Activation sequence for point stimulation experiment (same experiment depicted in A). Black lines are isochrones, spaced 1 ms apart; arrows indicate direction of wave propagation. (C) Simulated
  map for point stimulation at the center of the left ventricle. (D) Activation sequence for point stimulation simulation; details are as in B. (E) Optical upstrokes from selected locations as marked in A and C. (F) Comparison of
  profiles from experiment and simulation. Lines along which profiles are taken are marked by dashed black lines in A and C; the stimulation site corresponds to distance = 0.

