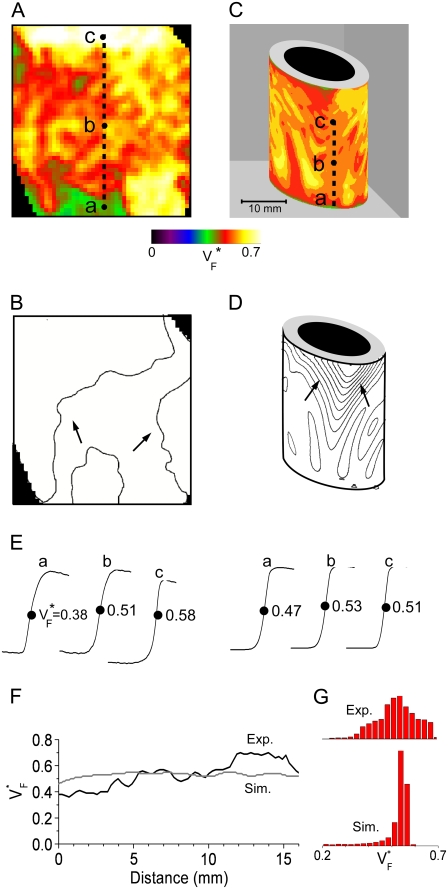
FIGURE 4.
Variation of upstroke morphology during sinus rhythm in experiment and simulation. (A) Experimental  map during sinus rhythm. The dashed line marks a section of the surface that we use for comparison of profiles (see F). Details are as in Fig. 2 A. (B) Activation sequence for sinus rhythm experiment (same experiment as in A), with details as in Fig. 2 B. (C) Simulated
  map for sinus rhythm (same experiment as in A and C; the stimulation site corresponds to distance = 0. (G) Histograms comparing
  distribution in simulations and experiments. Amplitudes have been normalized to achieve equal total histogram area.

