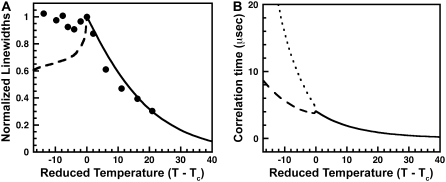
FIGURE 2.
(A) Normalized half-height line-widths for deuterium MAS NMR. The data points are from Veatch et al. (3) and the solid line is calculated for the effects of reaction kinetics due to the formation and dissociation of complexes of cholesterol and DPPC (5). The dashed curve below the critical temperature corresponds to the calculated line-width for the most abundant condensed phase. It is calculated that this phase would have the largest splitting in the absence of spinning, but the smallest line-width with spinning. The line-width is calculated as in Radhakrishnan and McConnell (5) except that the effect of the gradient energy term is omitted. (B) Correlation time associated with chemical reaction kinetics. The dashed line corresponds to the dominant phase, as in panel A. The dotted line corresponds to the less abundant phase. Calculated line-widths for this phase are omitted in panel A.

