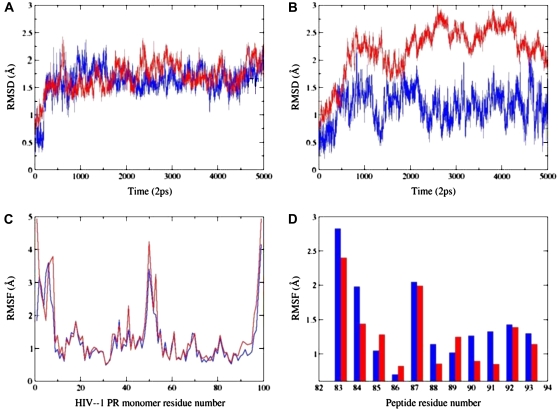
FIGURE 5.
(A) The RMSD values for Cα atoms along the 10-ns trajectory corresponding to the folding inhibition mode. Time evolution of the peptide is shown in blue; time evolution of the HIV-1 PR monomer is shown in red. (B) The RMSD values for Cα atoms along the 10-ns trajectory corresponding to the dimerization inhibition mode. Time evolution of the peptide is shown in blue; time evolution of the HIV-1 PR monomer is shown in red. (C) The RMSF values of the HIV-1 PR monomer residues from 10-ns trajectories corresponding respectively to the folding inhibition mode (shown in blue) and dimerization mode (shown in red). (D) The RMSF values of the peptide residues (using numbering of the 83–93 protease monomer segment) from 10-ns trajectories corresponding respectively to the folding inhibition mode (shown in blue) and dimerization mode (shown in red).

