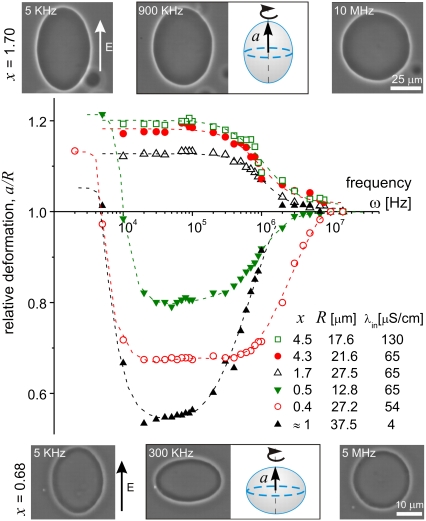
FIGURE 1.
Deformation of vesicles subjected to AC fields (E = 0.2 kV/cm). For conductivity ratio x > 1, the vesicles undergo prolate to sphere transition with increasing field frequency. For x < 1, two successive, prolate to oblate and oblate to sphere transitions are observed. The size of the symbols reflects the measurement error. The dashed lines are guides to the eye. Snapshots of two vesicles with different x-values are given above and below the figure. Schematic drawing of the vesicle shapes at intermediate frequency are given with indication for the semi axis a. The field direction is indicated with an arrow.

