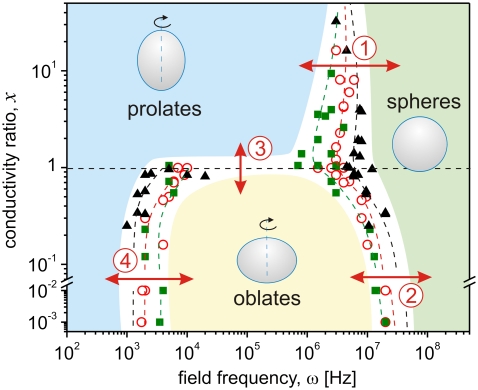
FIGURE 2.
Morphological diagram of lipid vesicles subjected to AC fields of various frequency ω at different conductivity ratios x = λin/λex. The internal conductivity λin in units μS/cm is: 15 (squares), 65 (open circles), and 130 (triangles). The dashed lines are guides to the eye, and the shaded areas indicate zones of specific morphology (see text for discussion on the four types of transitions).

