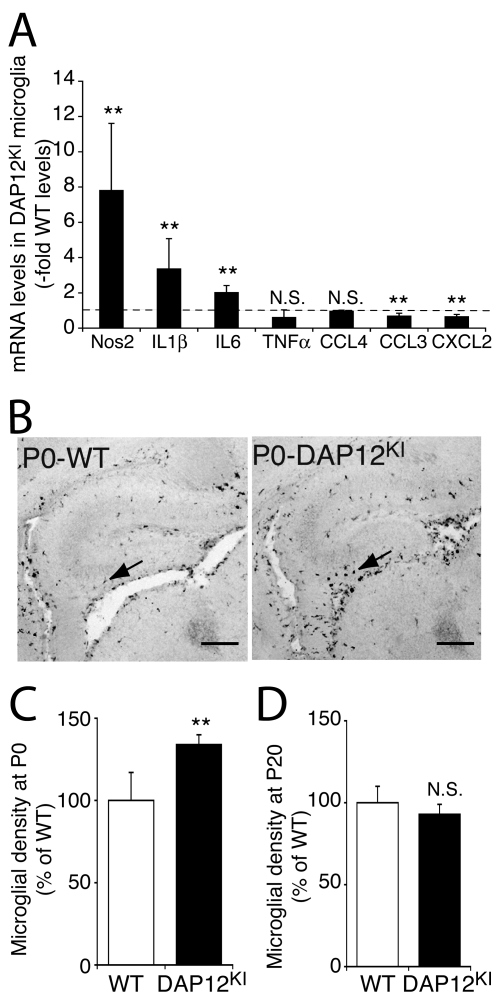
Figure 3. Microglia of DAP12KI mice display a partially activated phenotype at birth.
(A) Quantitative analysis of the expression of inflammatory markers in DAP12KI microglia. Quantitative RT-PCR performed on pure microglia cultured from brains of WT or DAP12KI P0 pups. The levels in the mutant microglial cultures are expressed relative to the levels in the WT microglial cultures. n = 3 pairs of cultures. **p<0.05, Student's t test. (B) F4/80 labeling of microglia (arrows) in the hippocampus of WT and DAP12KI pups. Scale bar: 100 µm. (C) Quantification of microglial density in the hippocampus of WT and DAP12KI animals at P0. Between 4 and 15 pairs of matched slices were counted per experiment, n = 3 experiments; **p<0.001, two-way ANOVA. (D) Quantification of microglial density (Iba-1 positive cells) at P20 (n = 4 experiments).

