
Figure 3.
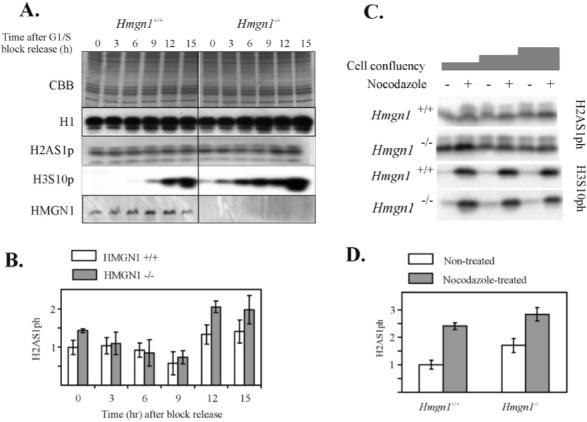
Effect of HMGN1 on H2AS1ph during mitotic arrest and throughout the cell cycle. (A) After Hmgn1+/+ and Hmgn1-/- cells were synchronized at the G1/S border, the growing medium was replenished with drug-free medium and the cells harvested at the indicated times. Whole-cell extracts were resolved by electrophoresis on a 15% SDS-polyacrylamide gel and immunoblotted with antibodies to H1, H2AS1ph, H3S10ph, or mouse HMGN1. (B) H2AS1 phosphorylation signals were plotted for Hmgn1+/+ (white bars) and Hmgn1-/- (gray bars) as a function of time after G1/S block release. The bars represent mean values from four separate measurements, whereas error bars represent SD. (C) Hmgn1+/+ and Hmgn1-/- MEFs, grown to different levels of confluence, were treated with nocodazole for 16 h and analyzed by Western blotting using antibodies against H2AS1ph and H3S10ph. (D) H2AS1 phosphorylation signals were normalized as above and plotted for nocodazole-treated (mitotic cells, gray bars) or nontreated (confluent cells, white bars) cells for the least-confluent Hmgn1+/+ and Hmgn1-/- cells. The bars represent mean values from three separate measurements, whereas error bars represent SD.