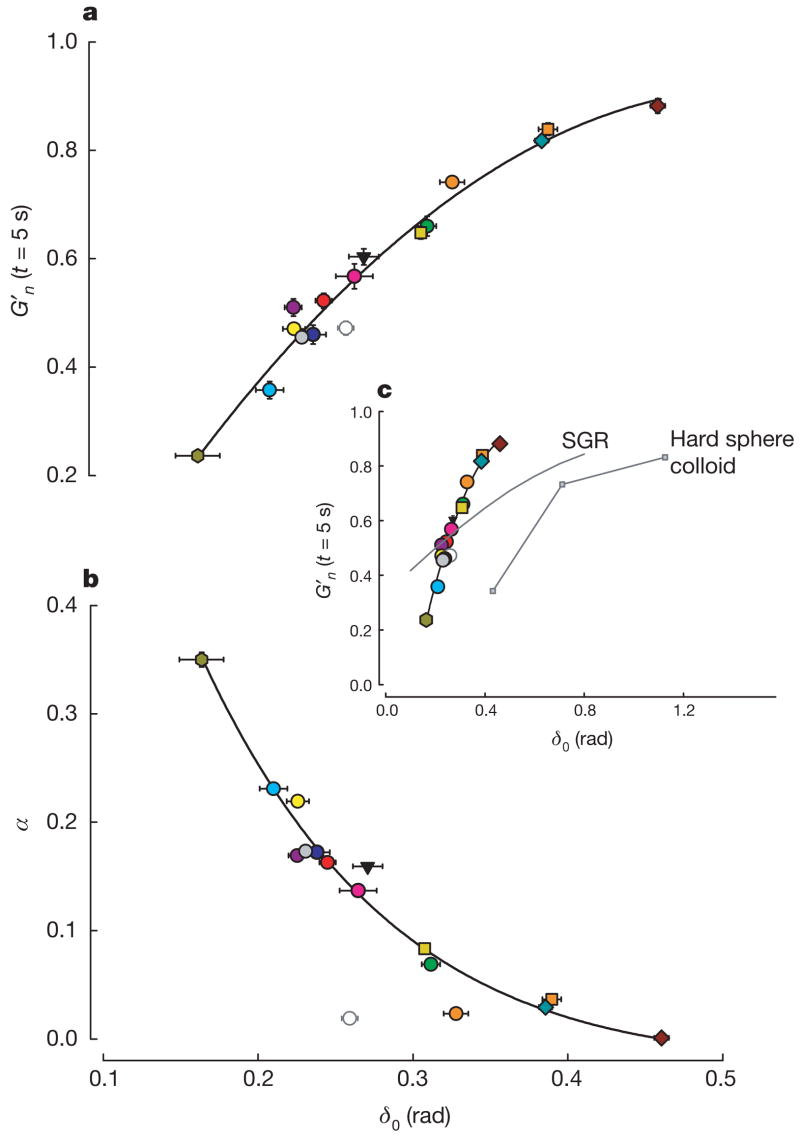
Figure 3. Two unifying relationships describe the response to stretch of a broad variety of cell systems.
In every case, the closer the system was to the solid-like state (δ0 = 0) before being subjected to transient stretch, the greater was the extent of its fluidization and, except for the case of ATP depletion, the faster was its subsequent recovery. Master curves of G′n at the earliest time point recorded after stretch (a) and of the initial rate of stiffness recovery α versus the pre-stretch phase angle δ0 (b). α was assessed by fitting a power-law to the first 30 s of response after stretch cessation. Error bars indicate standard errors. When plotted again over the full range possibilities (c), cells are seen to lie much closer to the solid-like (δ0 = 0) than the fluid-like (δ0 = π/2) state. In response to shear of similar magnitude, cells show a fluidization response comparable to but to the left of hard sphere colloids (data adapted from ref. 4). Soft glassy rheology theory5 (Supplementary Note 7) captures these trends but substantially underestimates sensitivity to changes of δ0. n values are given in Supplementary Table 1. Colours are as in Fig. 2 with the addition of HASM PBS (dark blue), HBE Latrunculin A (orange squares), MDCK cytochalasin D (brown diamonds) and BASM tissue (green hexagons).

