
Figure 4.
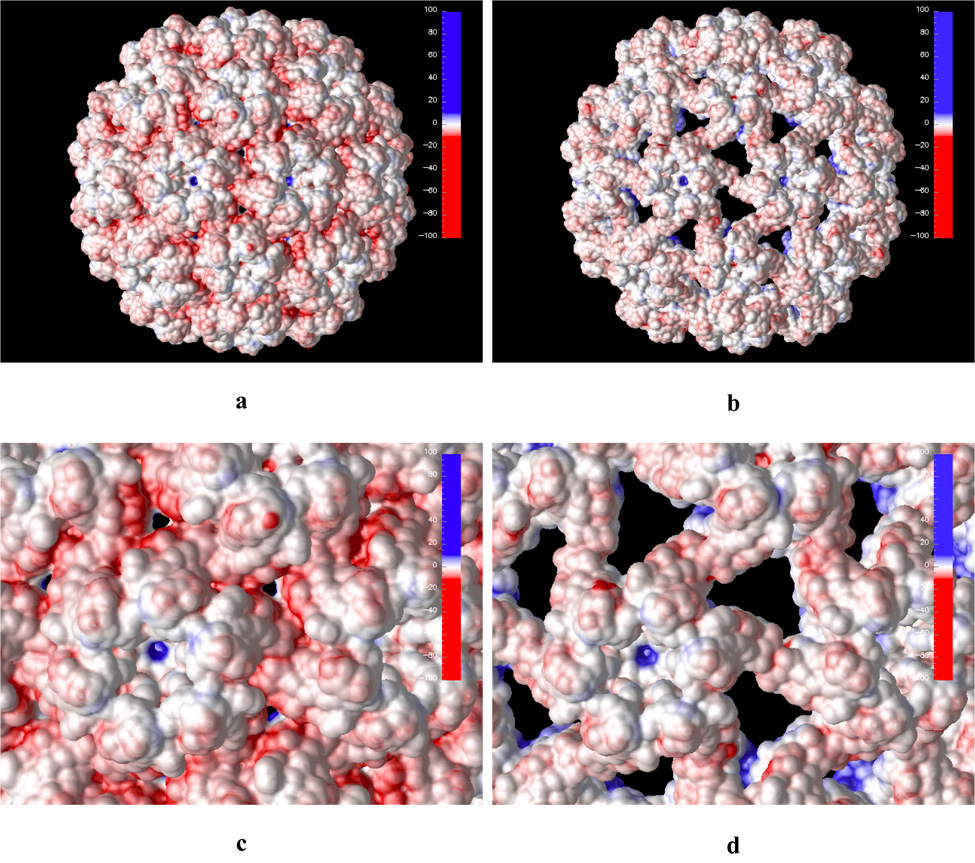
Calculated electrostatic potential projected on the solvent accessible surface of the native (a and c) and swollen (b and d) CCMV capsid. Subfigures c and d show closeups of the outer capsid shell. Blue and red colors represent positive and negative electrostatic potential, respectively. Hue intensity depicts strength of the potential (in kT/e units) as shown on the scale in the top right corner of each picture.