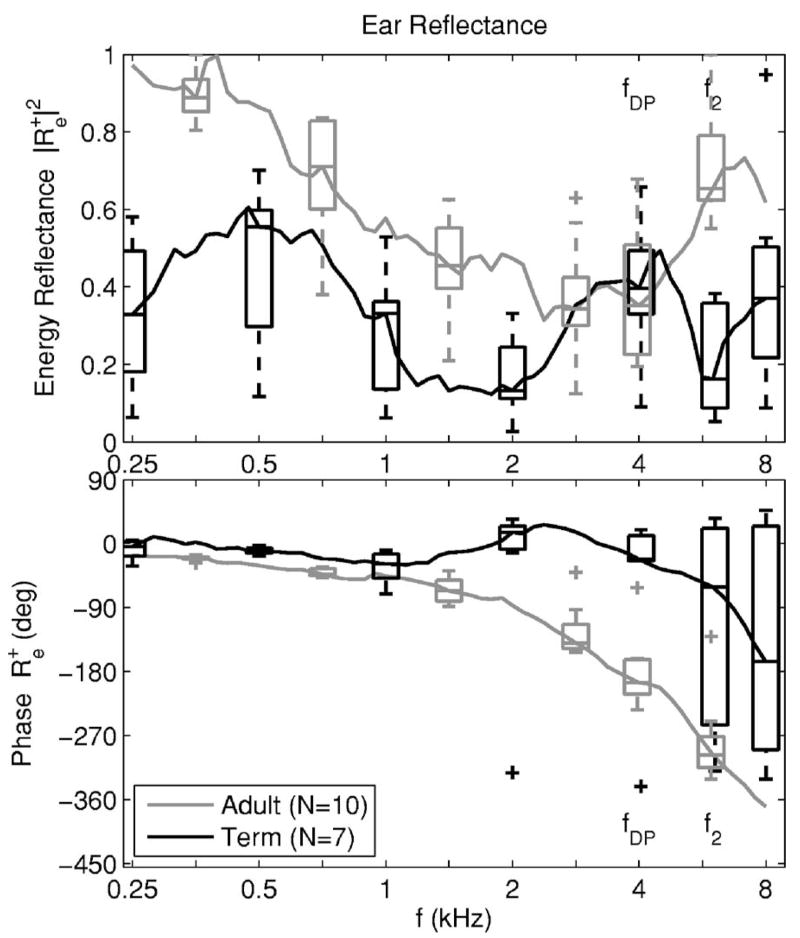
FIG. 3.
The median ear-canal reflectance (average in frequency over each 1/12th octave) is shown for the adult group (gray line) and the full-term infant group (black line). The distribution of ear-canal reflectance responses in each group is also shown by box and whisker plots spaced an octave apart. Box and whiskers plots are shown at each of the fDP and f2 frequencies. The ear-canal energy reflectance is shown in the top panel and its unwrapped phase is shown in the bottom panel.

