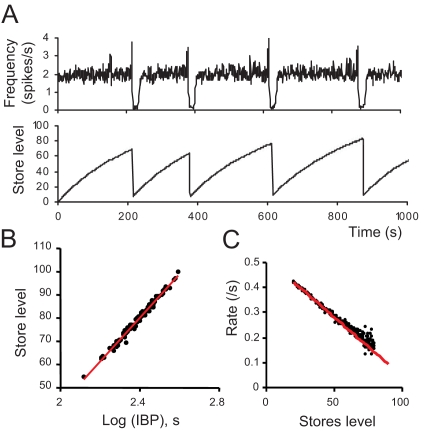
Figure 7. Role of Dendritic Release in Generating Bursts.
(A) Upper trace: The evolution of the mean firing rate in the model (in spikes/s; average over all neurons); the vertical axis has been capped to highlight the fluctuations of the basal activity. Bottom trace: the evolution of dendritic stores level, given as the average over all the dendrites in the network; grey bars are SD. (B) The stores level at the time of the bursts (average over all dendrites) plotted against the logarithm of the inter-burst interval. (C) The rate of change of the stores plotted against the average store level. Both quantities are averaged over all dendrites. Mono-exponential behaviour, as expected from a process approaching saturation, would appear as a downward straight line, the slope being proportional to the average release rate from stores. This plot shows a slight departure from a mono-exponential trend at high stores levels, where there is a small decrease in the slope, corresponding to a reduction of the release rate, due to endocannabinoid release.

