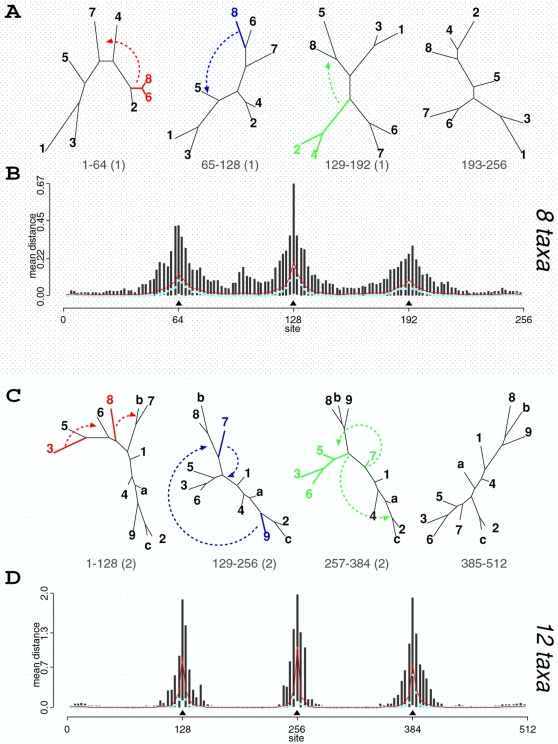
Figure 2. Bayesian analysis on simulations of eight (panels A and B) and 12 (panels C and D) taxa.
Panels A and C show trees used in the simulations. Branch lengths are proportional to the amount of evolution between nodes. Numbers below trees show site ranges over which the topologies were used, with true dSPR to the next topology in parenthesis. Disagreements between segments can be explained by one SPR between trees for the eight taxa scenario and two SPR moves between 12 taxa trees. From left to right, one possible SPR explanation is represented by arrows. The distributions of posterior mean SPR distances per segment over 100 simulated datasets (for each scenario) are shown in panels B and D. The black vertical lines are the 95% inter-quantile ranges, while the light blue dots are the median values over all datasets. The red lines are the mean values of the average SPR distance per segment. The true recombination breakpoints are represented by filled triangles.

