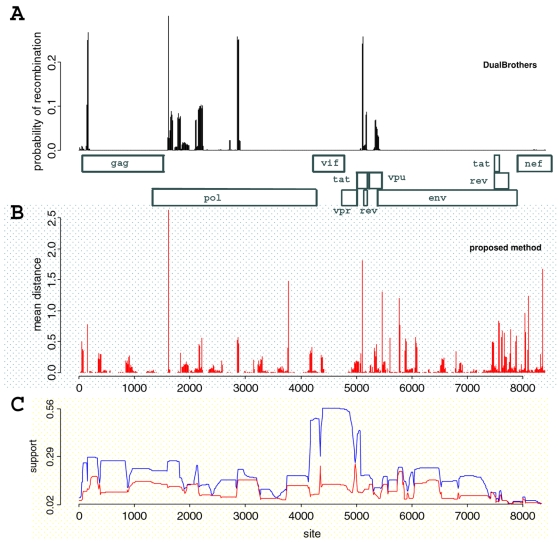
Figure 6. Evidence for recombination in HIV-1 genome sequences.
Panel A shows the posterior probability of having a recombination breakpoint based on analyses using DualBrothers software, with a schematic representation of HIV-1 genes in scale. Since we analyzed each of the eight putative recombinant sequences independently in DualBrothers, this overall posterior probability is given by the sum of individual distributions. Panel B represents the posterior distribution of SPR distances between 10 bp segments as inferred by our method using samples from two independent runs. The horizontal axis is in the same scale as panel A. The support (posterior frequency) for the two most frequent topologies over segments is shown in panel C. For each segment we have the frequencies of the MAP topology (blue line) and the second most frequent topology (red line).

