
Figure 3.
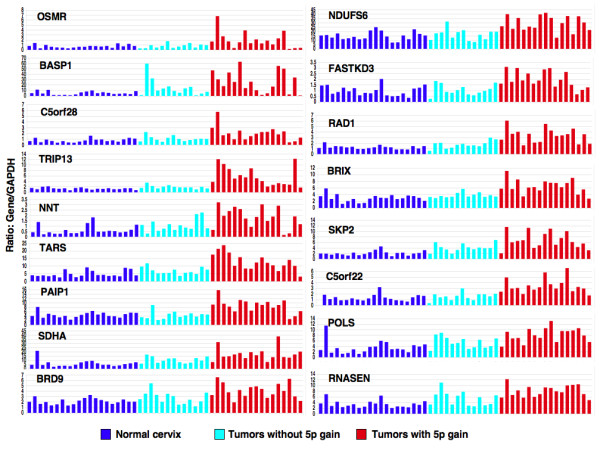
Relative expression of differentially expressed genes as a consequence of 5p gain in relation to GAPDH in normal and tumors with and without gain of 5p gain. Genes are shown on top left-side corner of each panel.
Official websites use .gov
A
.gov website belongs to an official
government organization in the United States.
Secure .gov websites use HTTPS
A lock (
) or https:// means you've safely
connected to the .gov website. Share sensitive
information only on official, secure websites.
Relative expression of differentially expressed genes as a consequence of 5p gain in relation to GAPDH in normal and tumors with and without gain of 5p gain. Genes are shown on top left-side corner of each panel.