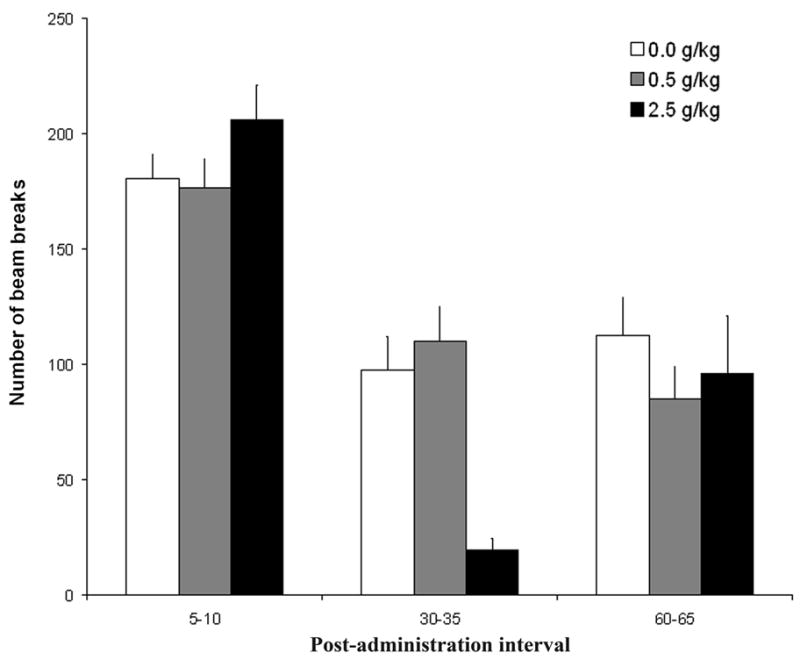
Figure 5.

Locomotor activity as a function of postnatal ethanol administration (0.5 or 2.5 g/kg) and post-administration interval (5–10, 30–35 and 60–65). In this figure we included only data from group E–I–L. Data are collapsed across minutes and prenatal ethanol treatment. The ANOVA revealed a significant interaction between postnatal ethanol treatment and post-administration time. Vertical lines illustrate standard errors of the means.
