FIGURE 3.
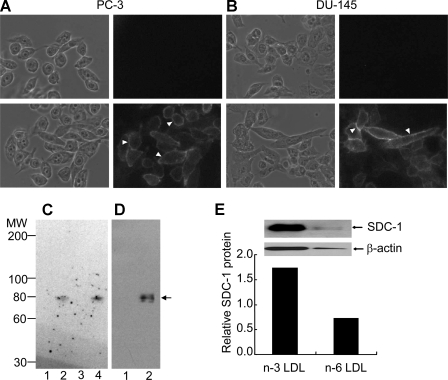
Identification of SDC-1 in human prostate cancer cell lines. Phase contrast and rhodamine channel images of PC-3 (A) and DU-145 (B) cells. Cells were grown in 35-mm dishes, fixed, and stained with (bottom) or without (top) 0.25 μg/ml anti-SDC-1 followed by 25 μg/ml rhodamine-labeled goat anti-mouse IgG. Arrowheads indicate representative regions of cell-surface staining. C, Western blot analysis of PC-3 cell extracts after glycosaminoglycan-degrading enzyme treatments. Proteins were resolved on a 3.5-15% SDS-PAGE gel, transferred to polyvinylidene difluoride membranes, and immunoblotted with a mouse α-heparan sulfate stub monoclonal antibody. Lane 1, untreated; lane 2, heparinase-treated; lane 3, chondroitin ABC lyase-treated; lane 4, heparinase plus chondroitin ABC lyase-treated. Chondroitin ABC lyase degrades chondroitin sulfate and dermatan sulfate glycosaminoglycans but not heparan sulfate proteoglycan. D, Western analysis using a SDC-1 core protein-specific antibody. Lane 1, untreated; lane 2, heparinase-treated. The arrow denotes the 80-kDa core protein of SDC-1. E, Western analysis using the SDC-1 core protein-specific antibody of heparinase-treated membrane proteins of PC-3 cells incubated with 100 μg/ml n-3 PUFA- or n-6 PUFA-enriched LDL. Data are presented relative to a no LDL control.

