FIGURE 2.
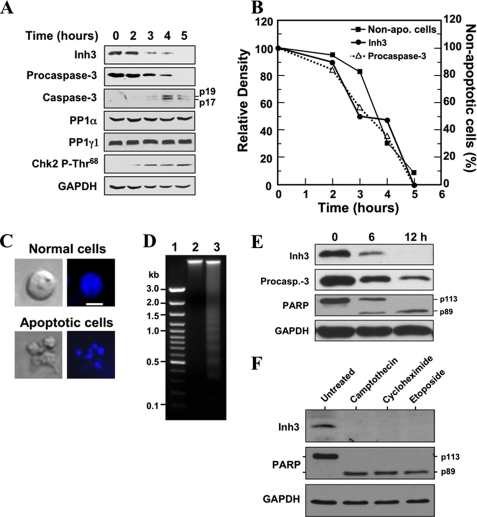
Inh3 is degraded during act-D-induced apoptosis in HL-60 cells in parallel with the activation of caspase-3. A, HL-60 cells were incubated with 4 μm act-D for the indicated times; cell lysates were prepared and subjected to Western blot analysis using the indicated antibodies. GAPDH was used as a protein loading control in the Western blots. B, the levels of Inh3 (solid circles) and procaspase-3 (open triangles) in the blots in A were quantified via densitometry and plotted against time. The percentage of apoptotic cells and nonapoptotic cells at each time point was determined by Hoechst staining (see “Experimental Procedures”). The data were plotted as percentage of nonapoptotic cells (solid squares). C, Hoechst 33258 staining of cells. The apoptotic cells exhibited irregular Hoechst nuclear staining with multiple bright specks of chromatin fragmentation and condensation. Normal cells were considered to have Hoechst-stained smooth nuclear regions. The images on the left are those obtained by light microscopy, and the images on the right were obtained by fluorescence microscopy. The white bar in the top right image is the scale for 10 μm. D, DNA fragmentation pattern of act-D-treated cells. HL-60 cells were untreated (lane 2) or treated with act-D for 5 h (lane 3). DNA was extracted and analyzed on 1.5% agarose gel electrophoresis after ethidium bromide staining. Lane 1, marker DNA. E, Inh3 is degraded in parallel with PARP during act-D-induced apoptosis. MOLT-4 cells were treated with 4 μm act-D for the indicated times. The cells were lysed and Western blotted for Inh3, caspase-3, PARP, and GAPDH. F, Inh3 degradation occurs during apoptosis induced by camptothecin, cycloheximide, or etoposide. HL-60 cells were treated with 10 μm camptothecin, 250 μm cycloheximide, or 250 μm etoposide for 5 h. The cells were then lysed and Western blotted for Inh3, PARP, and GAPDH. One representative experiment of three is shown.

