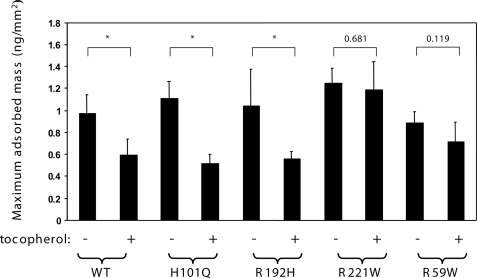
FIGURE 6.
Association of AVED variants with membranes. Maximum specific adsorbed mass observed with 500 nm concentrations of the indicated form ofαTTP to phospholipid membranes lacking or containing 6 mol% RRR-α-tocopherol was measured using DPI as described under “Experimental Procedures.” Data are representative of at least three independent measurements. p values were calculated with unpaired t tests, and highly significant differences (p < 0.03) are denoted by an asterisk. WT, wild type.

