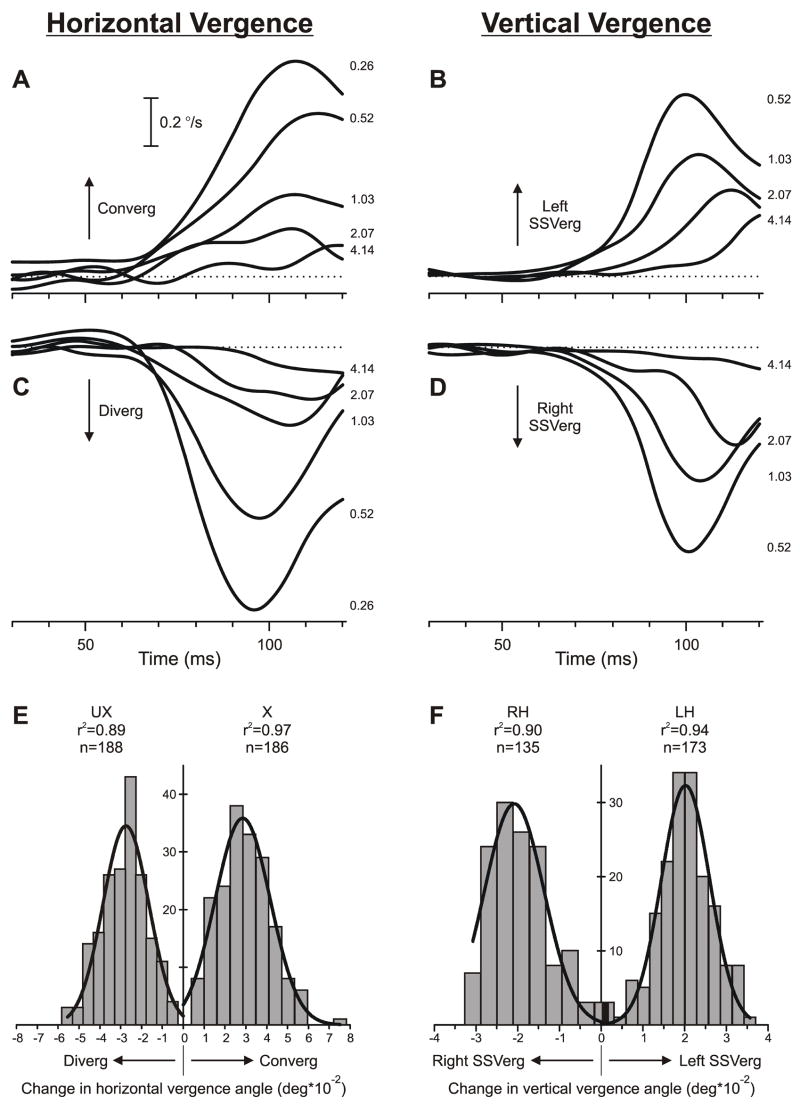
Fig. 2.
The initial vergence responses to ¼-wavelength binocular phase differences applied to pure sine-wave stimuli: dependence on spatial frequency. Upper 2 rows (A–D): Mean vergence velocity profiles (n=131–191) over time—derived from mean position signals by computing the two-point (15 ms apart) central difference between the symmetric weight moving averages (15 points) of the vergence-position sample (Usui & Amidror, 1982)—in response to gratings of various spatial frequencies (indicated in cycles/° by the numbers to the right of the traces, each located at the level of the relevant peak in the profile); horizontal dashed lines, 0°/sec. Bottom row (E, F): Distributions of the measured vergence responses (based on the change in vergence position over the 50-ms time period starting 60 ms after the appearance of the stimulus) recorded on individual trials in response to a given disparity stimulus: 0.26 cycles/° (E) and 0.52 cycles/° (F); curves are best-fit Gaussian functions (r2 values and number of measures, n, shown nearby). Left column (A, C, E): Horizontal vergence responses to crossed disparities (A; E, right histogram labeled “X”) and uncrossed disparities (C; E, left histogram labeled “UX”); convergent responses have positive sign, indicated by “Converg”, and divergent responses have negative sign, indicated by “Diverg”. Right column (B, D, F): Vertical vergence responses in response to left-hyper disparities (B; F, right histogram labeled “LH”) and right-hyper disparities (D; F, left histogram labeled “RH”); left sursumvergent responses have positive sign, indicated by “Left SSVerg”, and right sursumvergent responses have negative sign, indicated by “Right SSVerg”. Contrast, 32%. Subject, NPB.

