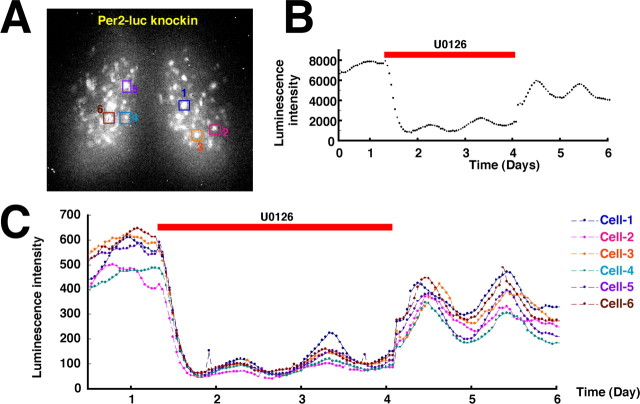
Figure 2.
The role of MAPK in individual SCN cellular clocks. A, A bioluminescence image of the SCN from a Per2-luciferase knock-in mouse. Square boxes indicate single SCN neurons whose bioluminescence was monitored. B, The total luminescence intensity of the SCN was measured in real time with a highly sensitive cryogenic CCD camera. U0126 (20 μm) treatment was performed for ∼65 h (red bar). C, The luminescence intensity from individual SCN neurons was measured in real time. The same sample as in B was analyzed at the single neuron level. The experiments were independently repeated four times with a different slice and gave similar results.

