
Fig. 4.
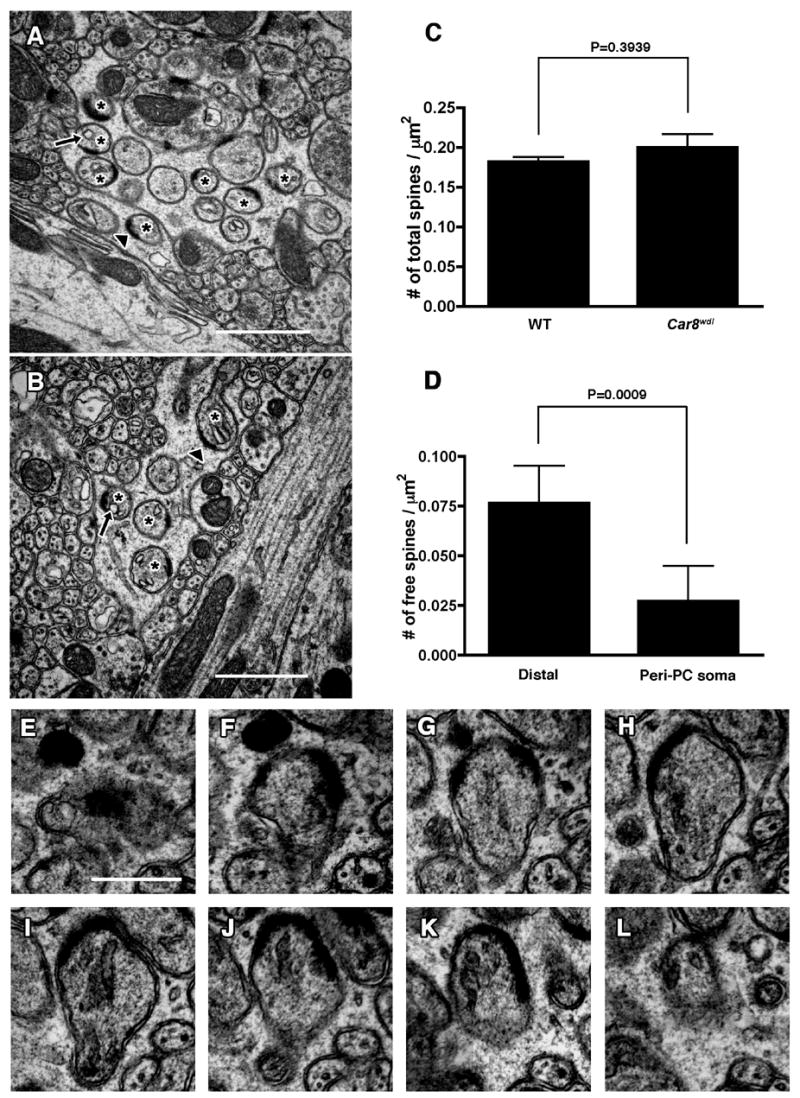
Electron micrographs of free dendritic spines in Car8wdl cerebellum. (A–C) Numerous free spines are observed in clusters at various positions in the molecular layer of the cerebellum. Representative images are shown from distal (A) and proximal (B) dendritic field to the PC soma. Asterisks denote free spines. Note that free spines contain postsynaptic density (arrowheads) and endoplasmic reticulum (arrows). Scale bars: 1μm. (C) Number of PC dendritic spines per area in wild type (WT) and Car8wdl mice. (D) Distribution of free spines in the molecular layer of Car8wdl mice. Numbers of free spines per area in the region adjacent to the distal border of the molecular layer (distal) and the region adjacent to the PC soma (peri-PC soma) are shown. Error bars represent standard deviation. (E–L) Serial electron micrographs of PC dendritic spine unattached to any nerve terminals (free spine) in Car8wdl mice. Scale bar: 500nm.