
Figure 2. Differential recruitment of checkpoint and repair proteins to IR- and endonuclease-induced DSBs.
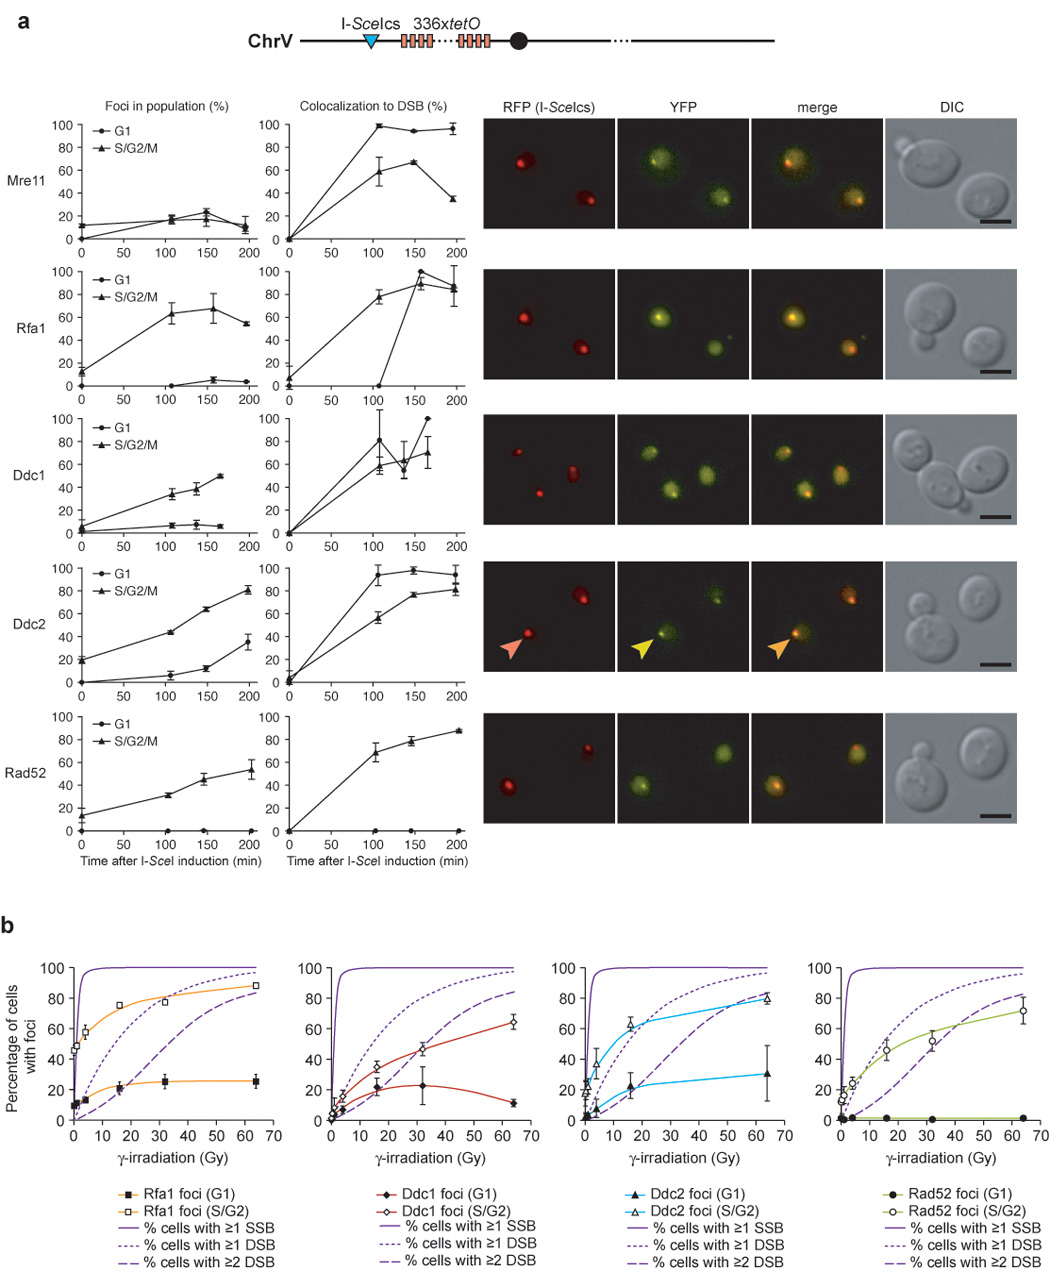
(a) Focus formation in response to an I-SceI-induced DSB. Expression of the I-SceI endonuclease was induced in cells harboring a fluorescently-marked I-SceI cut-site (I-SceIcs) and either Mre11-YFP (W4363-4B), Rfa1-YFP (W4362-1C), Ddc1-YFP (W4688-11D), Ddc2-YFP (W4364-9B) or Rad52-YFP (W4365-5B). The I-SceIcs is adjacent to an array of 336 copies of the Tet operator sequence in cells expressing the tet repressor fused to monomeric RFP, marking the locus as a discrete RFP dot. Focus formation and the percentage of colocalization with the I-SceI cut-site for each protein is plotted as a function of time after I-SceI was induced by addition of galactose. YFP, RFP, DIC and YFP/RFP merged images of representative cells are shown and selected foci indicated by arrowheads. Mre11 is recruited equally well to the I-SceI cut-site in G1 and S/G2/M. In contrast, Rfa1, Ddc1, and Ddc2 form very few foci in G1 cells in response to an I-SceI DSB.
(b) Proteins involved in DSBR do not respond to IR by forming foci at doses resulting only in SSBs. Dose dependency curves for Rfa1, Ddc1, Ddc2 and Rad52 foci, respectively, shown in the colored lines. The solid line indicates the predicted percentage of cells in the population receiving 1 or more SSBs, the dotted line indicates the predicted percentage of cells receiving 1 or more DSBs in response to IR, and the dashed line represents the predicted percentage of cells receiving 2 or more DSBs, assuming that 17 SSBs are generated for every DSB and that the number of breaks induced per cell follows a Poisson distribution (Friedland et al., 1999). None of the proteins form foci in response to low IR doses predominantly resulting in SSBs 60 minutes after exposure.