
Fig. 20.
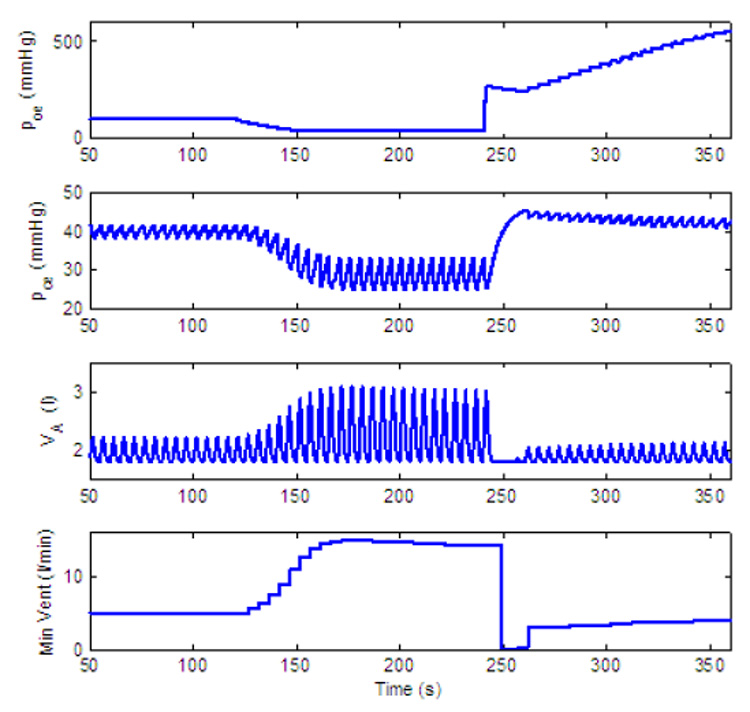
Dynamic response to decreased level of inspired O2 of a PI-controller with amplitude control only. gn = 13.2, Kn = 0.5, A2 = 0.05, B2 = 10, C2 = 0.002, D2 = 0.08. All the other parameters in the feedback functions are zero. For t < 120 s, fom = 21%, for 120 ≤ t < 240 s, fom = 5% and for t ≥ 240 s, fom = 100%.