
Fig. 25.
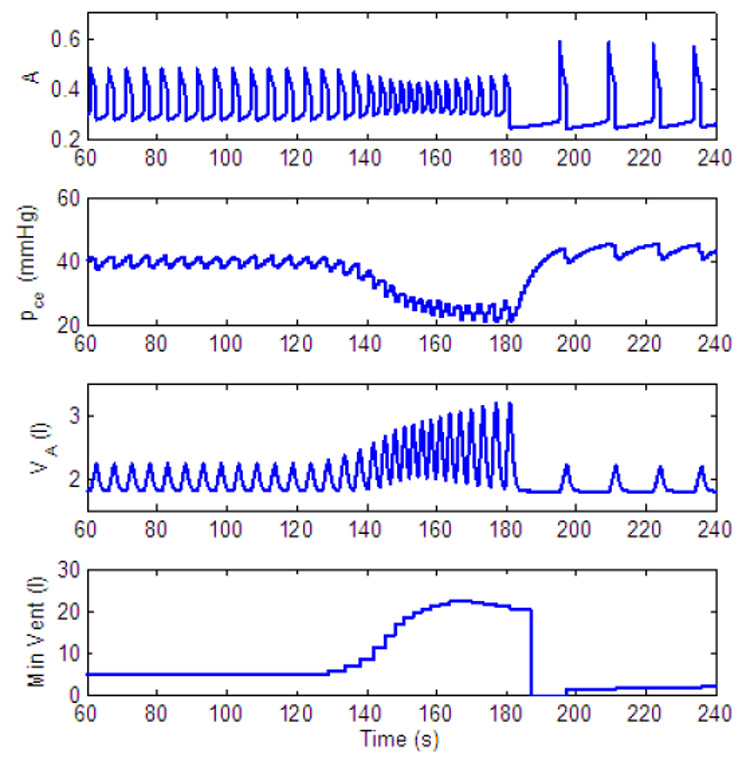
Dynamic response to decreased level of inspired O2 - another mechanism for apnea appearance. gn = 13.2, Kn = 0.5, B1 = 30, B2 = 10, C1 = 0.01. All the other parameters in the feedback functions are zero. For t < 120 s, fom = 21%, for 120 ≤ t < 180 s, fom = 5% and for t ≥ 180 s, fom = 100%.