
Fig. 6.
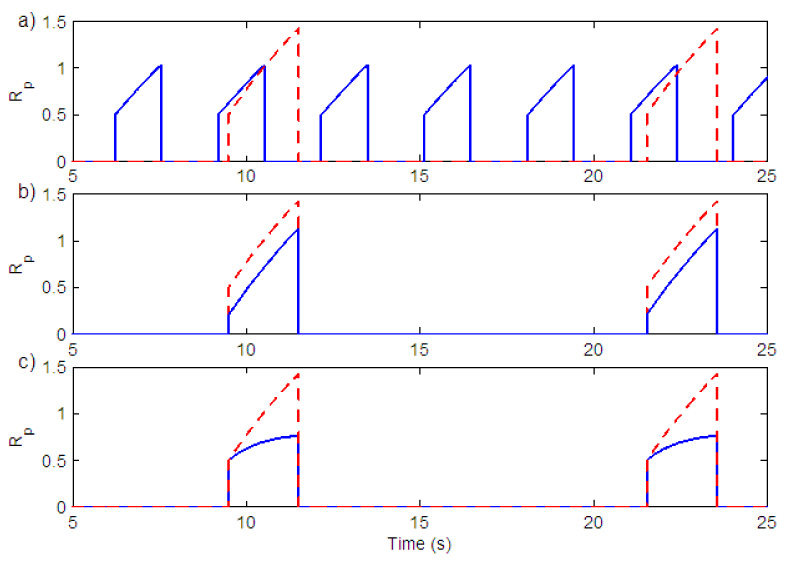
Amplitude control in the neural model. a) Variation in gn (change in the duration of inspiration). Solid (blue) line - gn = 17, (Kn = 0.5), Dashed (red) line - gn = 7, (Kn = 0.5) b) Variation in Kn. Solid (blue) line - Kn = 0.2, (gn = 7), Dashed (red) line - Kn = 0.5, (gn = 7). c) Variation in the amount of leak in the integrator. Solid (blue) line - Il = 0.9995, Dashed (red) line - Il = 0.99999. Kn = 0.5, gn = 7 in both graphs.