
Figure 11.
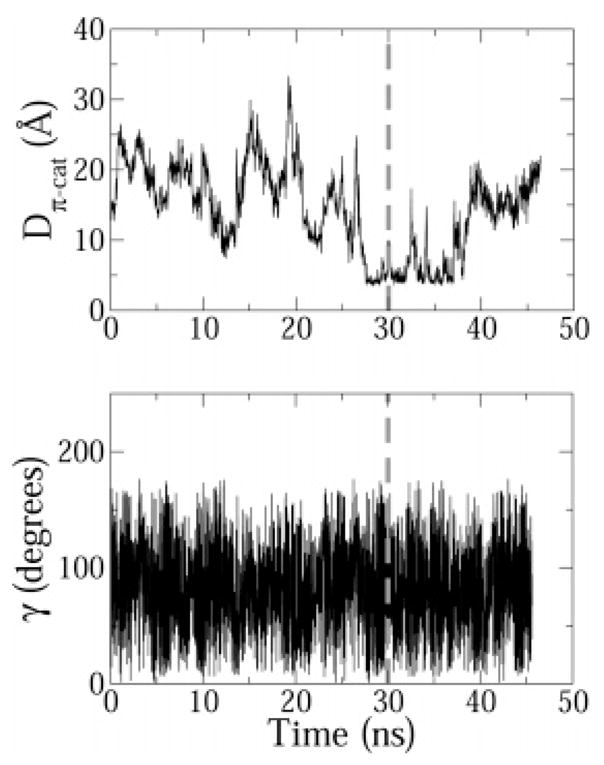
Distance Dπ–cat and angle γ time profiles for the cation–π interaction between TRP4 and DPC14. For clarity purposes, a gray dashed vertical line is drawn at t = 30 ns, the time after which ensemble averages were calculated.
Official websites use .gov
A
.gov website belongs to an official
government organization in the United States.
Secure .gov websites use HTTPS
A lock (
) or https:// means you've safely
connected to the .gov website. Share sensitive
information only on official, secure websites.
Distance Dπ–cat and angle γ time profiles for the cation–π interaction between TRP4 and DPC14. For clarity purposes, a gray dashed vertical line is drawn at t = 30 ns, the time after which ensemble averages were calculated.