
Fig. 2.
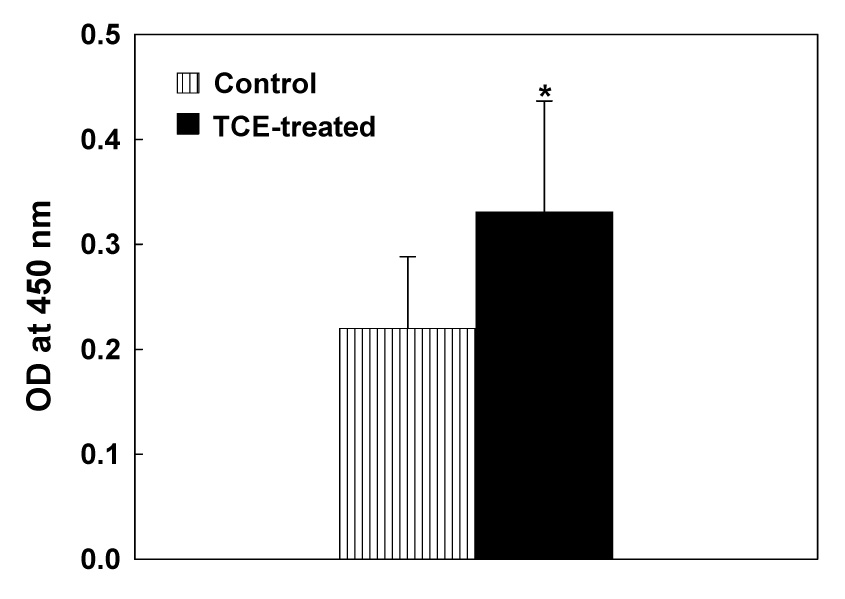
Serum ANA levels in MRL+/+ mice treated with TCE for 4 weeks. The values are means ± SD of eight animals in each group. Net OD values exceeding the negative control values by more than 0.2 were considered positive. The numbers of mice positive for ANA were 0/8 and 5/8 for control and TCE-treated mice, respectively. * p < 0.05 vs. controls.