
Fig. 6.
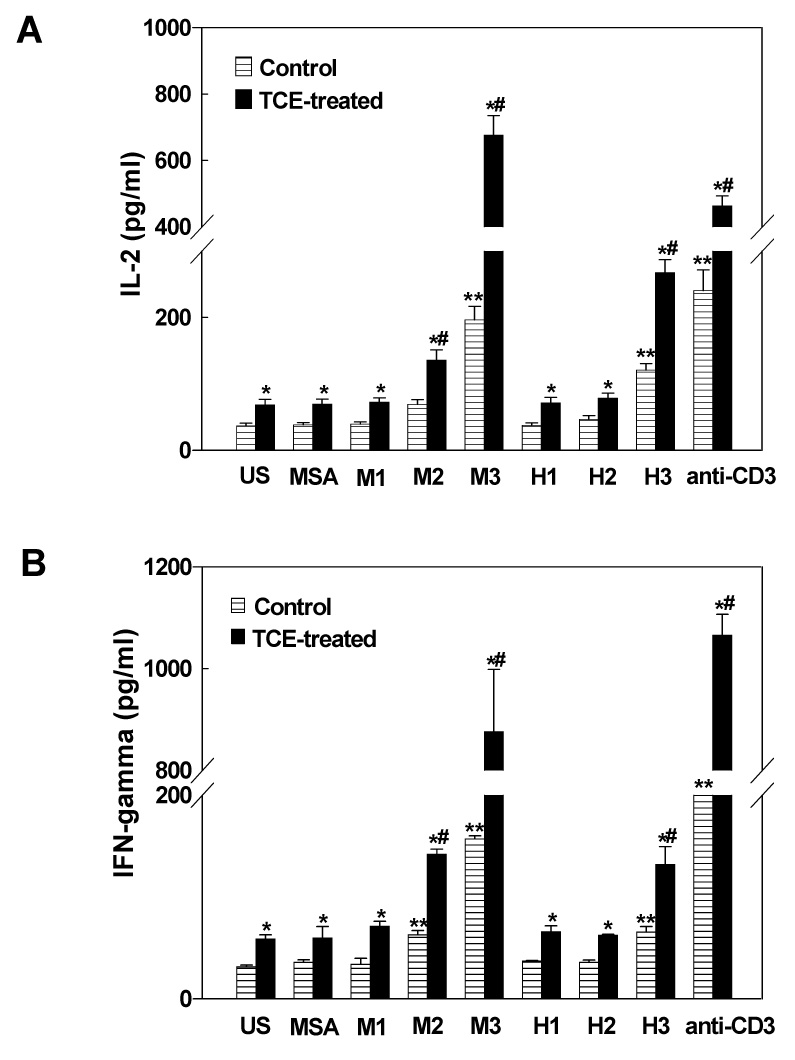
Release of IL-2 (A) and IFN-γ (B) into splenocyte cultures of control and TCE-treated MRL+/+ mice. Splenocytes were incubated with MSA alone, increasing concentrations of MDA-MSA (M1–M3), HNE-MSA (H1–H3), or anti-mouse CD3 antibody for 72h and the release of IL-2 and IFN-γ into cultures were measured by ELISA. The values are means ± SD of eight animals in each group. US: unstimulated cells. * p < 0.05 vs. respective controls; # p < 0.05 vs. MSA; ** p < 0.05 vs. MSA controls.