
Figure 1.
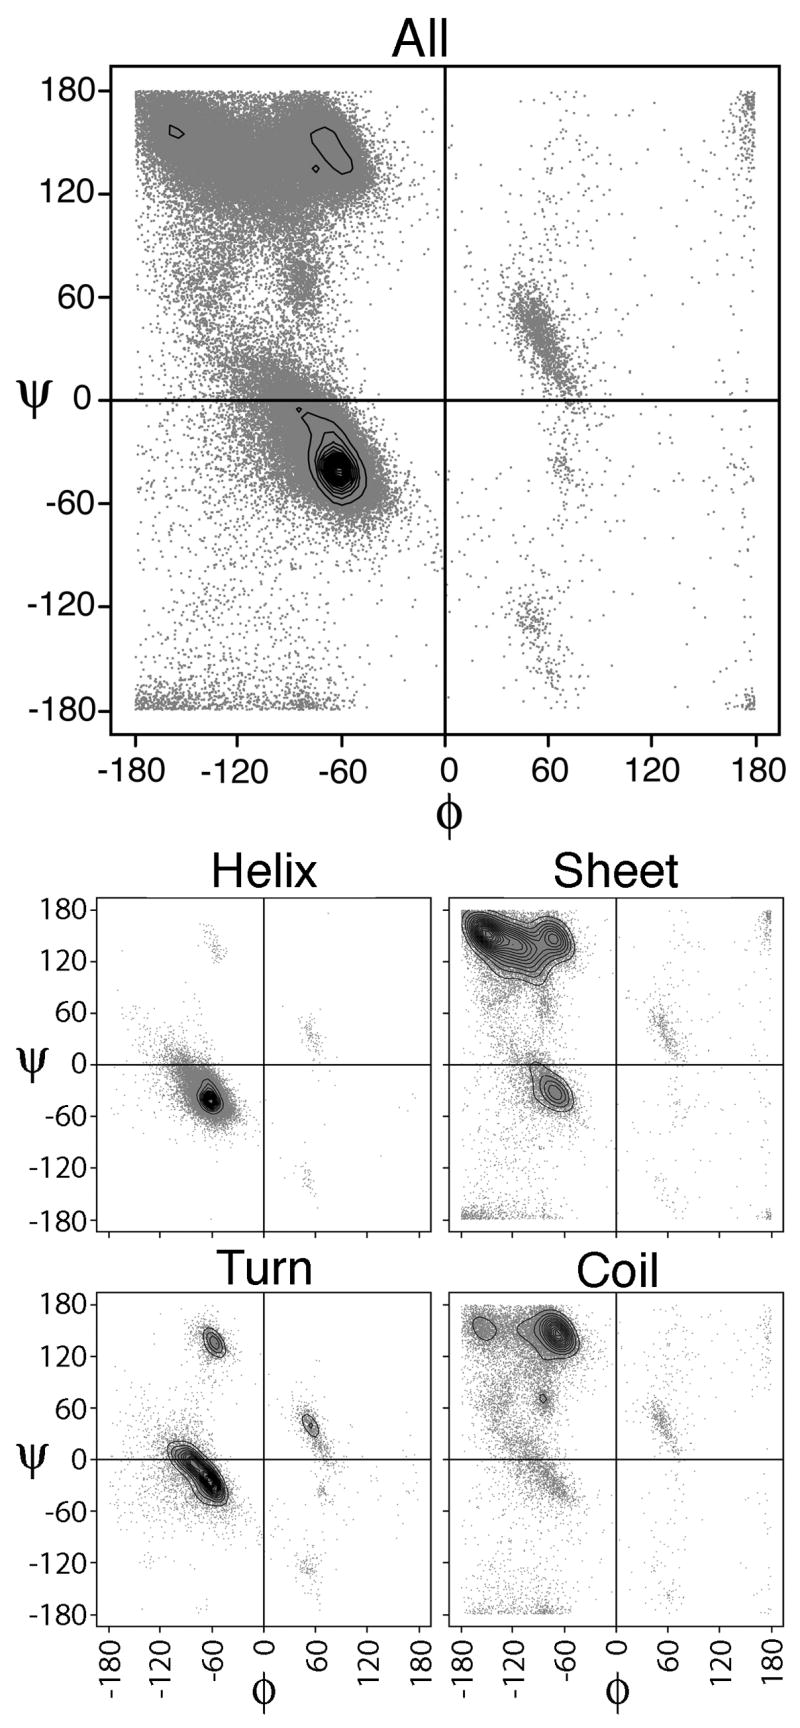
Ala Ramachandran plots of the 5 classes. Raw torsion angle data is shown by grey dots, while density estimated distributions are overlaid using contour representations of the. Distribution classes are labeled above their respective plots. Highest peak in the All and Helix (H) distributions occurs at (−65°, −40°). For Sheet (E), this peak is at (−150°,150°), for Turn (T) at (−65°,−20°) and for Coil (C) at (−70°,140°).