Fig. 7.
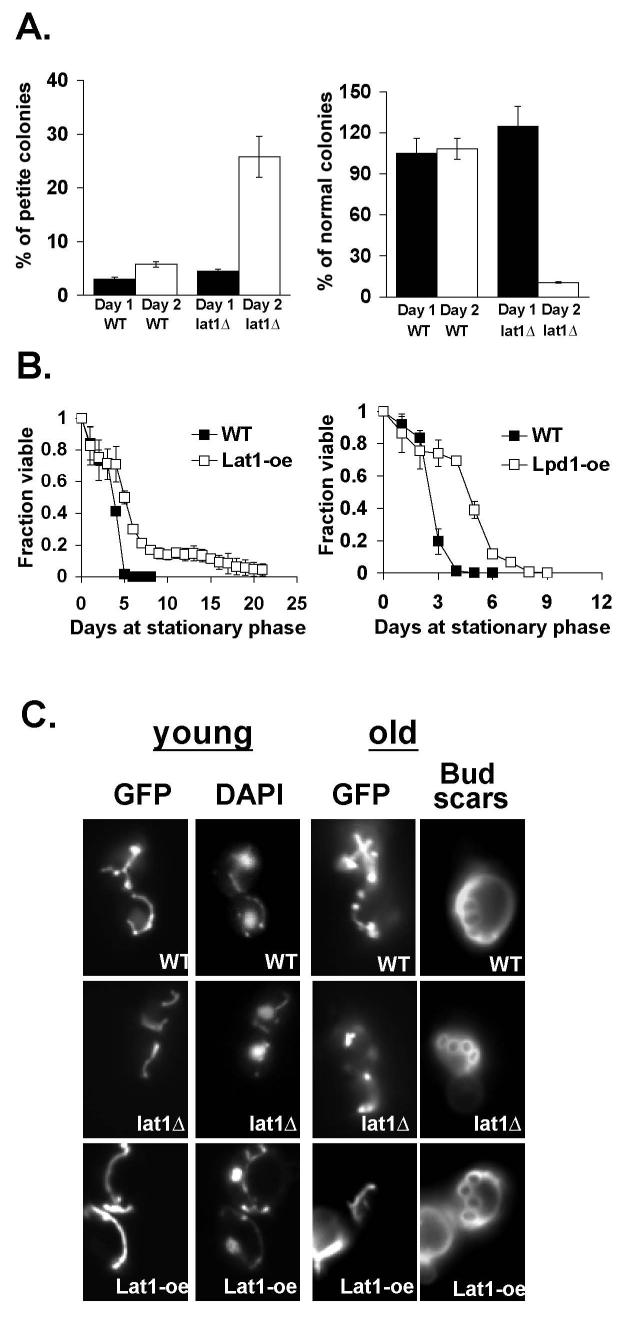
Lat1 affects metabolic fitness of cells. A, The lat1Δ mutants exhibit decreased mitochondrial fitness and viability after prolonged culture. For each strain, 1000 cells derived from one-day old cell patches or 2-day old single colonies were plated onto YPD plates. Colony forming units were determined after 3 days. Left panel shows the percentage of petite colonies and right panel shows the percentage of colonies grown to normal size both derived from the same experiment. One representative set of two independent experiments, each conducted in quadruplicate, is shown. Error bars denote standard deviations. B, Lat1 and Lpd1 over-expression extends chronological life span. Fractions of viable wild type, Lat1-oe and Lpd1-oe cells were determined from cultures grown to stationary phase. One representative set of three independent experiments, each conducted in triplicate, is shown. Error bars denote standard deviations. C, Lat1 over-expression delays age-dependent changes in mitochondrial structure. GFP denotes the localization of the mitochondrial inner membrane F0 ATPase. DAPI denotes nuclear and mitochondrial DNA. One set of representative data is shown. WT: BY4742 wild type with (7B), or without (7A and 7C) a control vector; Lat1-oe: Lat1 over-expression; Lpd1-oe: Lpd1 over-expression.

