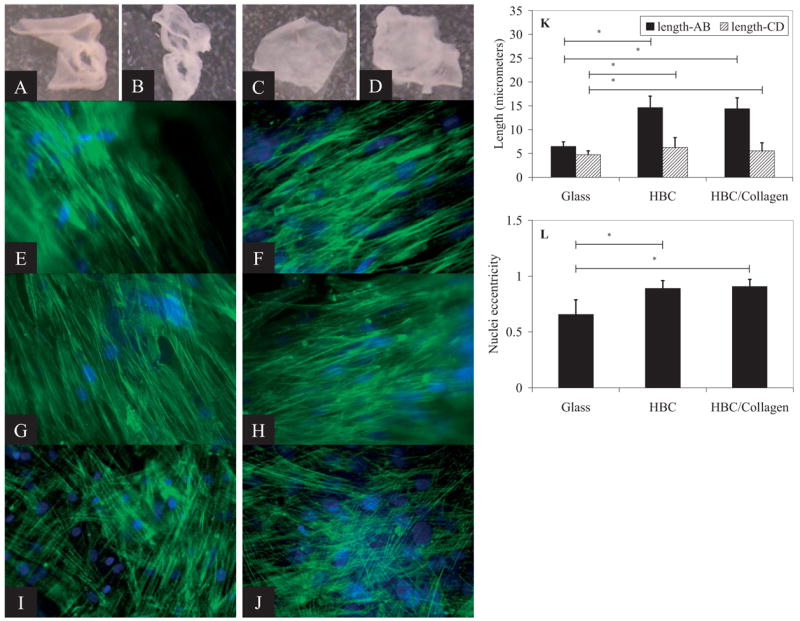
Figure 2.

Cell sheet production and cellular morphology on HBC and HBC/collagen fiber surfaces after 2 week culture. hMSC on HBC fibers before cooling (A) and after cooling (B). hMSC on HBC/collagen fibers before cooling (C) and after cooling (D). Corresponding F-actin (green) and nucleic acid (blue) stained images for hMSC on HBC fibers before (E) and after cooling (G), and HBC/collagen fibers before (F) and after cooling (H). Images of hMSC on HBC (I) and glass (J) surfaces show random arrangement of cell cytoskeleton. Lengths of long and short axis of nuclei (K). Asterisks represent p-values ≪ 0.0001. Eccentricity values for hMSC on glass and HBC fibers (L). Scale bars: 100 μm.
