
FIGURE 4. The effects of mutations in the interdomain region.
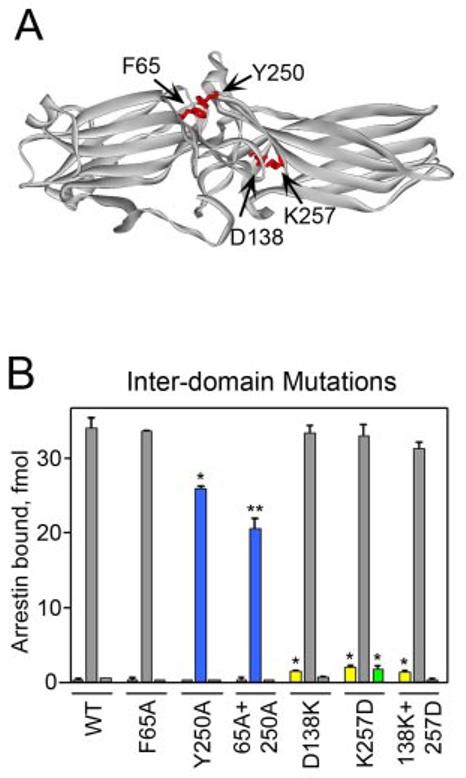
A, top view of the visual arrestin crystal structure highlighting residues between the two domains that were mutated. B, the binding of each radiolabeled arrestin produced in cell-free translation to dark P-Rh (left), P-Rh* (center), and Rh* (right) is shown. Results are color-coded as follows: blue, mutations that significantly reduce P-Rh* binding; yellow, mutations that enhance dark P-Rh binding; green, mutations that enhance Rh* binding; gray, mutations that do not significantly affect binding. Means ± S.D. from two experiments performed in duplicate are shown. *, p < 0.05, **, p < 0.01, as compared with wild-type (WT) arrestin.