
Figure 1.
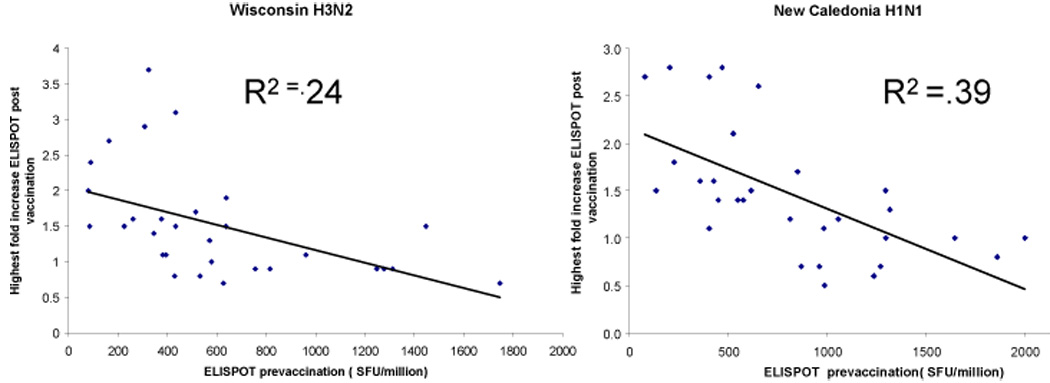
Relationship between the number of IFNγ producing cells at baseline and peak fold increase after immunization using ELISPOT assay. Linear regression analysis was performed using all data available for the three time points for the H3N2 A/Wisconsin/67/05 strain (left panel) and the H1N1 A/New Caledonia virus/20/99 (right panel). SFU= spot forming units